Cell Coverage in the United States.
High resolution cell coverage data is envied by businesses all over the country. Unfortunately, providers and cell tower owners keep a tight leash on cell coverage information.
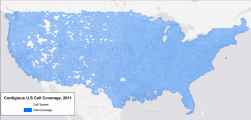
Recently, I was asked by a telecom company to produce a cell coverage base map where they could overlay their assets and customers; helping them to quantify their need for, and best locations of new cell tower construction within their service area.
Recently, I was asked by a telecom company to produce a cell coverage base map where they could overlay their assets and customers; helping them to quantify their need for, and best locations of new cell tower construction within their service area.