Debris Basin Volume Measurement
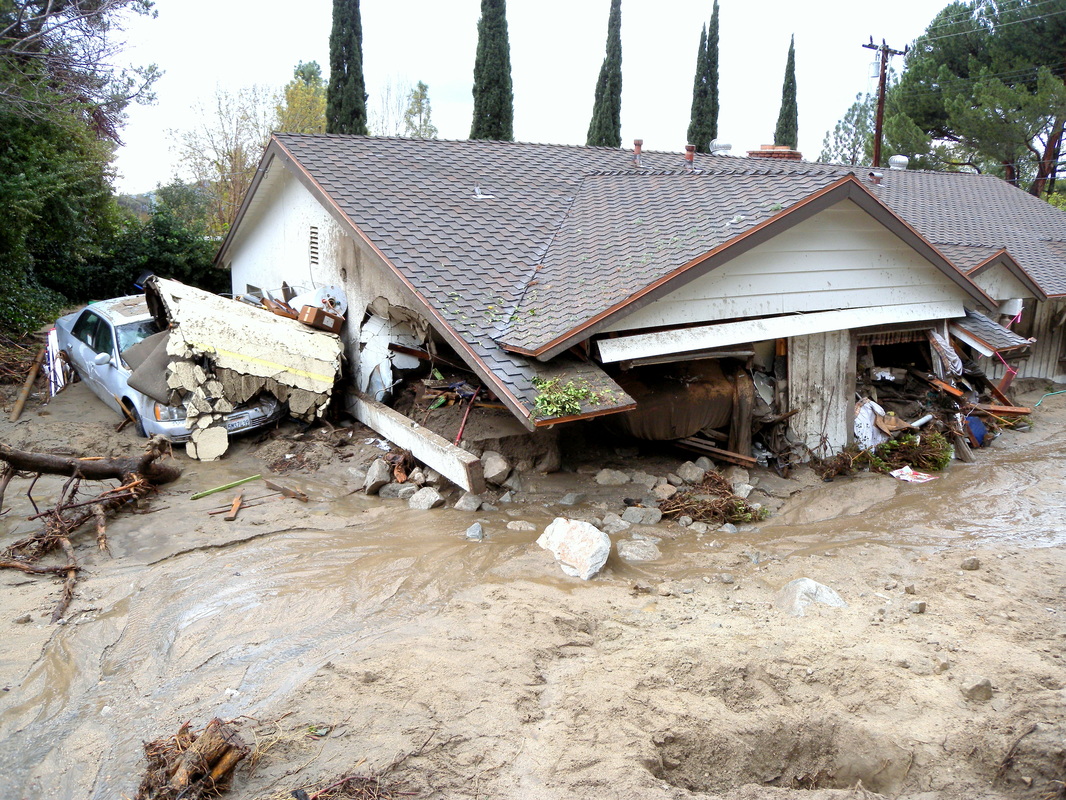 Debris flow damage. La Canada Flintridge, CA.
The risk of forest fire related hazards is increasing in the greater Los Angeles area. Development into the "wildland-urban interface" increases the exposure of houses, public infrastructure and people to a variety of direct (fire) and indirect (rockfall, landslides, debris flow, etc...) wildfire hazards. Indirect hazards increase in occurrence after wildfires burn steep landscapes, leaving people and their property at risk for damage for years after a wildfire is extinguished. In August through September of 2009, the Station Fire burned 160,000 acres in the Sierra Madre mountain range, a majority of which was within the Angeles National Forest. In the winter of 2009-2010 and 2010-2011, serve rainstorms have triggered debris flows, resulting in significant property and infrastructure destruction in the residential developments and highways in and around Pasadena, California.
|
|
Why Measure?

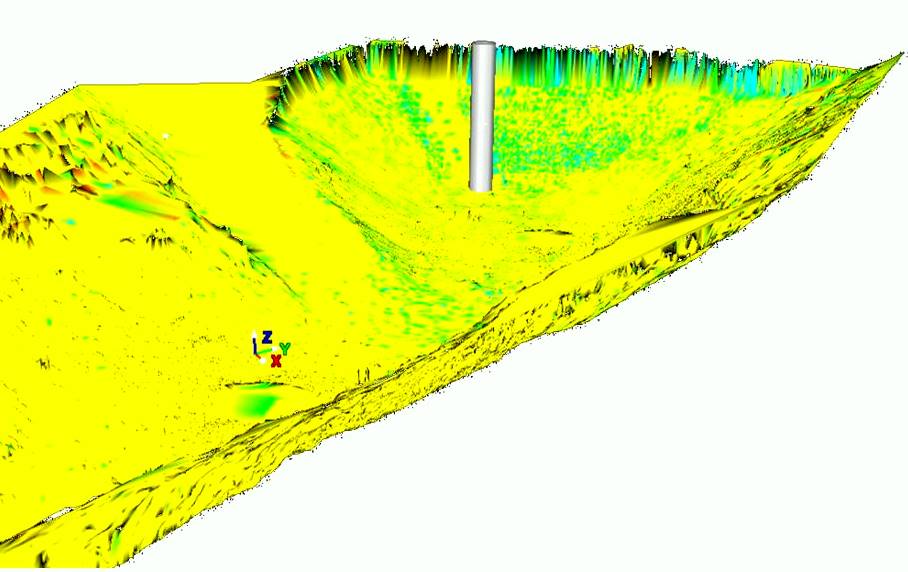
Debris Basin and Snorkel
The USGS (US Geologic Survey) provides debris flow inundation prediction for areas that are at risk for debris flows. This warns residents (similar to a flood warning) when and where debris flows are likely to occur and also provides them with maps of the areas that will be potentially inundated. The accuracy of the USGS predictions are crucial. Predicting the magnitude, location and time of debris flow events is still an inaccurate science, which leads to a majority false positive debris flow warnings. As a result of the false positive warnings, most people disregard the warnings by refusing to leave their home, making them susceptible to the hazard of a debris flow.
In addition to the debris flow warnings, debris basins (left) provide a level of physical protection from debris flows by capturing and storing the flows (water, sediment and boulders) before they reach developed areas. The debris basins also provide a way of measuring the amount of sediment that is transported from the burned areas, since they capture most of the debris flows which flow towards areas of development. Knowing the quantity of sediment in these debris basins allows researchers at the USGS a way of calibrating their debris flow prediction models, thereby increasing the models accuracy, reducing the occurrence of false positive warnings, and subsequently reduce the hazard of debris flows.
In November of 2010, I led a three person survey team to La Canada Flintridge, California where we scanned 12 debris basins over 2 1/2 days. Our surveys provided the USGS with a very accurate assessment of the storage capacity of 12 debris basins.
Field Methods
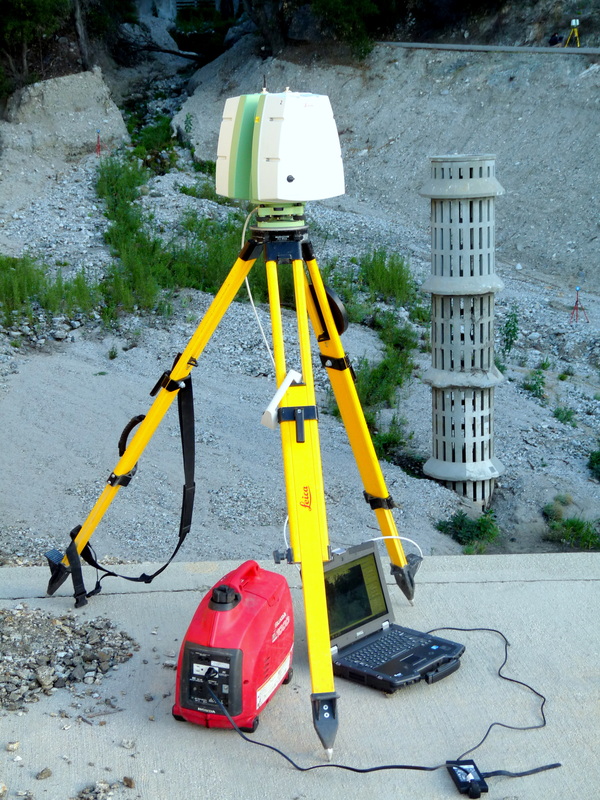 Scanner Setup
The survey campaign employed two Lecia C10 terrestrial laser scanners, two dell ruggized laptops, and five Leica targets. Eight Leica C10 on-board hot-swappable batteries provided an entire day worth of scanning. A generator was used for recharging the Dell laptop batteries which only provided enough laptop power for two scans and target acquisitions. Most of the basins were topographically simple, therefore we typically established no more than two scan locations per debris basin, meaning we could survey with both scanners in two separate locations and finish in the time of a single scan. Most scan locations were at the resolution of 2.5cm at 25-40m. Registration error for each debris basin ranged from 0.001 meters to 0.01 meters, with most debris basins accruing ~0.004 meters of registration error.
|
 Debris basin scan location |
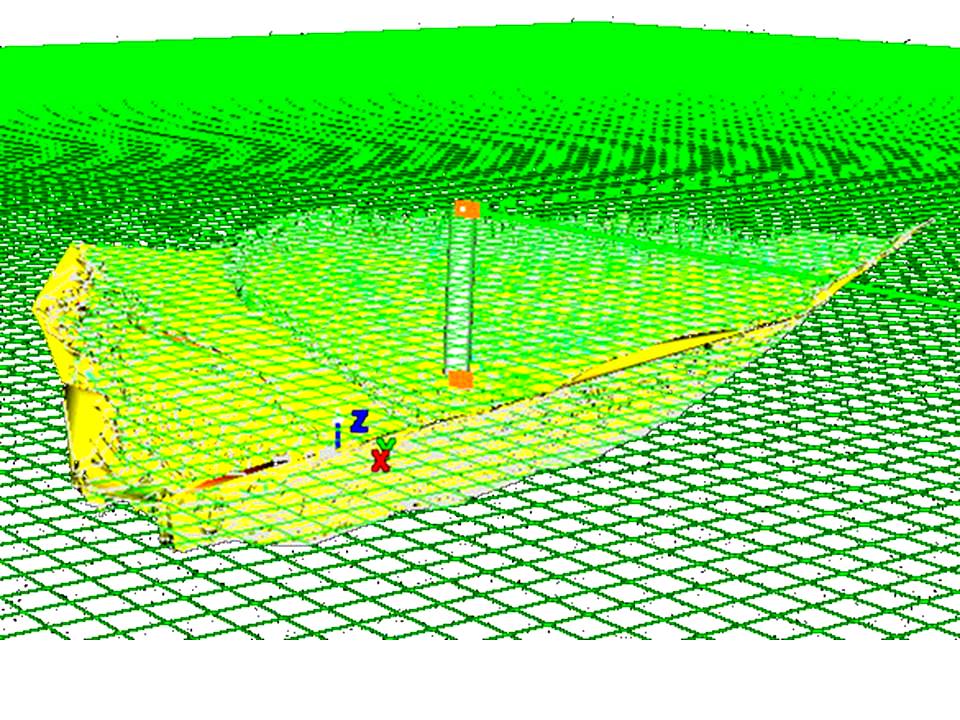
The scans from each of the debris basins were combined and registered within Cyclone 7.1. A reference plane was fit at the top of each debris basin snorkel, and since the volume of each debris basin cannot exceed the top of the snorkel, all points above the reference plane were deleted. Significant vegetation re-growth in most of the debris basins necessitated manual vegetation filtering using a limit box approach in Cyclone 7.1. A limit box allows temporary point cloud segmentation, reducing background noise, assisting with the removal of unwanted points (i.e. vegetation, targets, etc...). However, there is a high degree of probability that not all points
representing vegetation were removed using this process. Therefore,
volume measures should be considered as minima volumes as missed
vegetation points would decrease the overall volumes. A cylinder was fit to each debris basins snorkel. The cylinder serves as a perfectly vertical measuring tool, facilitating volume measurements at set intervals, beginning at the top of the snorkel and moving down.
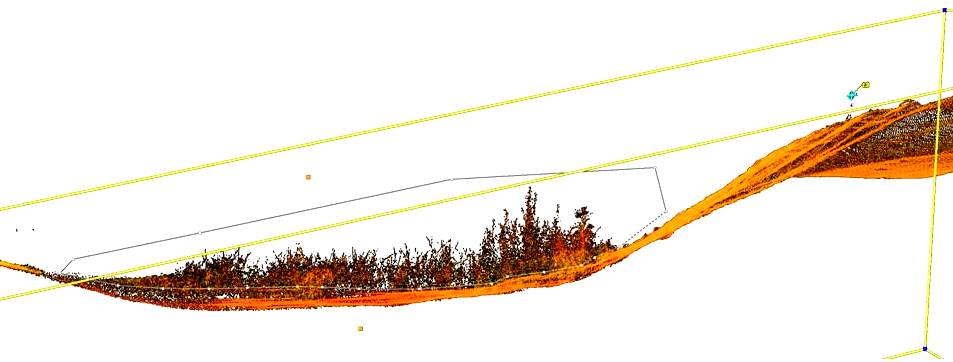 Vegetation filtering with limit box (yellow) and cropping tool (white) |
|
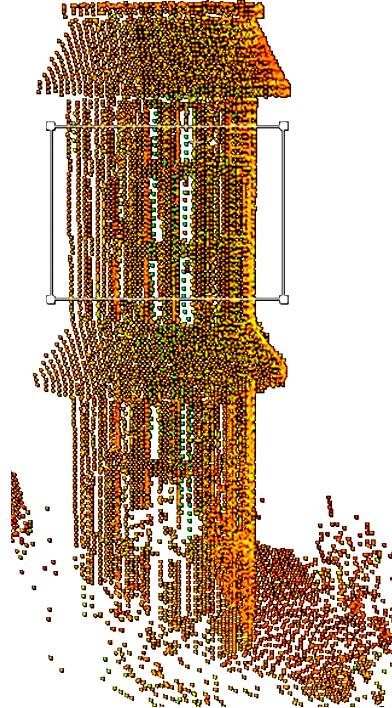
Each debris basin, once filtered for vegetation, was meshed using an "up-direction" Triangulated Irregular Network (TIN) resulting in a Digital Terrain Model (DTM) for each debris basin. A reference plane was fit to the top of the modeled cylinder and volume measurements were made from the reference plane down to the DTM. On average 100 measurements were made per square meter to calculate the volume measurements. Once volume was calculated at a given height, the cylinder was moved down along the z axis, -0.333 meters (1 foot), the reference plane was moved to fit the top of the cylinder and another volume measurement was made. This was repeated until volume is zero.
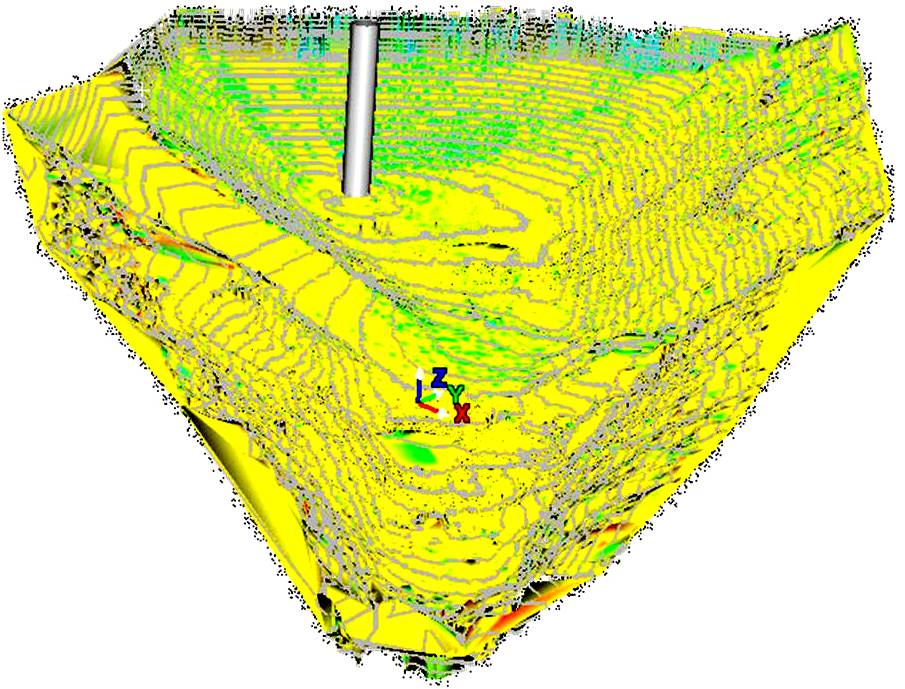 Mesh with 1-foot contour intervals |
|

Completed debris basin volume measurement at a single height.
This work is based upon work supported by a Cooperative Agreement with
U.S. Geological Survey Landslide Hazards Program entitled "Close-Range
Photogrammetry and Terrestrial Laser Scanning Data and Analysis" - Thad
Wasklewicz, PI
