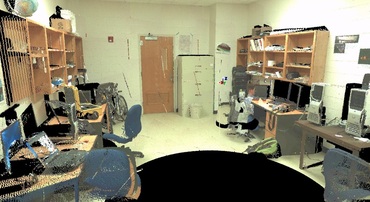
3D scanner accuracy is often tossed around loosely in spec-sheets and by sales reps. 1mm @ 25 feet, beam divergence, compensator accuracy... - it is very confusing and often does not reflect the true accuracy. Understanding the real world accuracy of a 3D scan is very important as most point cloud users expect point clouds to be perfectly accurate. Here we set out to test the real world accuracy of the Matterport 3D scanner.
 I am excited to announce that I have been asked to join LiDAR News as a Distinguished Contributor. LiDAR News is one of the largest information points for laser scanning on the internet and the only dedicated laser scanning print publication. I was asked to begin contributing content a few weeks ago and had my first article published online yesterday. The article will also be published in the LiDAR News print publication next month. 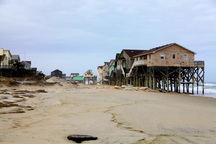 Houses near Nags Head, NC Currently, the Outer Banks is witnessing significant rates of beach erosion, most of which is a function of sea level rise. In opposition to popular reporting, sea level rise and fall are a natural phenomenon which have been continuing for millennia. Currently we are in a period of sea level rise (Riggs and Ames 2003), the rate of which (most scientist agree) has been increased by human influenced global climate change (Gornitz et al. 1982). On the Outer Banks the effects of sea level rise are compounded by land subsidence from glacial isostatic adjustment. In fact, due to the local influence of land subsidence the Outer Banks could be experiencing a 60% greater rate of relative sea level rise in comparison to the national average of the United States (Cabanes et al. 2001). In March, 2011, I traveled to the Pea Island national wildlife refuge to terrestrial laser survey a section of overwashed dune in an attempt to establish a long term overwash monitoring site within the Cape Hatteras National Seashore. As I have detailed previously, overwash is an important aspect of barrier island landward migration and thus an important area of research along the Outer Banks, which is a barrier island. This is especially true if you also consider the amount state owned infrastructure and privately owned houses which are currently impacted or have the potential to be soon impacted by barrier island landward migration. 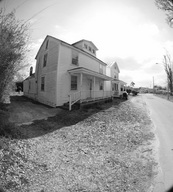 On 3/25/2011 I traveled to New Bern, North Carolina to terrestrial laser scan a historic house. The house, which was thought to have been built circa ~1900, is one of the few houses which survived a 1922 fire which devastated African American neighborhoods in New Bern causing over 2 million dollars in damage. Our terrestrial laser scan survey provided field measurements for modeling of the house and visualization back to its original state (vinyl siding and other alterations have been made over the years). This model and the laser scan survey will serve as the visual corner stone for the planned "trail of flames" website, which promotes a historic tour of burned areas from the 1922 fire in New Bern. 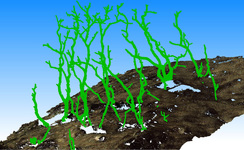 Segmented terrain (brown) and vegetation (green) A basic premise for all laser scanners (and remote sensing techniques in general) is that they remotely sense, capturing objects within their field of view. However, not everything which is located within a scanners field of view is useful, and in most instances extraneous data has a negative impact on the quality of the collected data. This is something that some leading laser scanning industry voices are beginning to notice as the next big hurtle for laser scanning to overcome, that is making a laser scanner only collect what you need, not everything within the scanners field of view. However, for now we must remove unwanted data and this requires filtering to identify, classify and separate the wanted and unwanted data. Although there are a myriad of filtering methods, the following paragraphs will detail three, relatively simple methods of filtering data from terrestrial laser scanner point clouds. For my Masters Thesis I am using Terrestrial Laser Scanned surveys from the GAP fire to investigate the effects of a recent wildfire on hydrologic and sedimentologic connectivity during the first significant rain event. Here I show examples of the captured terrain, hydrologic networks and their alteration, caused by the first significant rain event after the wildfire disturbance.
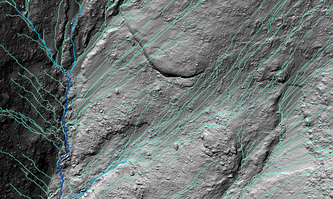
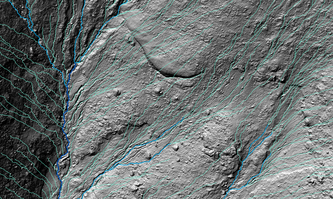
The surveys are both 1cm Digital Earth Models (DEMs). However, computationally the grids are larger than can be handled in ArcMap, therefore the DEM was re-sampled to a resolution of 2cm so that hydrologic networks could be calculated. Mean absolute errors for x, y, and z in both surveys were less than or equal to +/- 3mm. The procedures for hydrologic flow network delineation are based on the Deterministic 8 (D8) model for flow over a 2cm DEM. The D8 method produces a single flow direction towards the steepest slope of one of eight grid cells neighboring the initial center cell (O’Callahan and Mark, 1984; Tarboton, 2003). The D8 method was chosen for its simplicity and widespread use in hydrologic terrain analysis (Kiss, 2004). 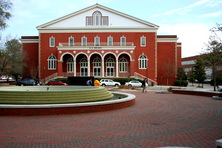 The Wright Building A long term goal of the Terrain Analysis Lab at ECU is to Terrestrial Laser Scan building or structures on East Carolina's campus that are both historically significant and recognizable landmarks, commonly associated with the image of East Carolina University's campus. Additionally, students enrolled in the Geography departments Terrestrial Laser Scanning graduate and undergraduate course were invited to assist, so that they could have hands on experience with the laser scanner in a real world environment. To satisfy these goals we chose to scan the Wright Building, located in the center of East Carolina University's campus. The Wright building was built in 1925, and along with the Cupola, is an iconic architectural structure on campus. I had written previously about the better image quality when using the Nodal Ninja setup, compared with the images of the built in web cam on the Leica C10. Below is a comparison, but before you examine the images let me make a few statements.
1) The imagery from the web cam in this instance I consider to be very good. 2) I took the scan images and the Nodal Ninja images on two separate days, so some stuff (chairs, bikes, book bags, etc...) changed position. This results in the images and point cloud not matching up perfectly for the nodal ninja example. 3) The resolution of the scan was 1cm at 10m 360x270. 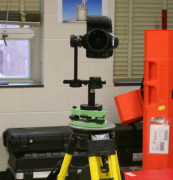 Nodal Ninja setup Took out our Nodal Ninja setup out for our Leica C10 laser scanner today. If you don't know what a Nodal Ninja is, it is a bracketed camera mount that fits into a terrestrial laser scanner's tribrach. It provides a way of overlaying higher quality images onto scanned point clouds than are provided by the "web cam" like camera built into most laser scanners. The major advantage of the nodal ninja setup is that it enhances the color quality of the images and not so much that it adds resolution over the built in camera. The images look incredible with our Cannon 5D Mark II with Sigma 8mm f/3.5 fish eye lens attached to the Nodal Ninja. The unbelievable field of view of the fish eye lens and 5D's full frame sensor gives the panorama advantages over just about any other camera used with this setup, allowing for almost perfect coverage with only three pictures, and near perfect exposure without a flash in just about all lighting conditions. This makes the camera ideal for taking pictures outside and from multiple scanning locations over the course of a day, since the 5D will give similar pictures regardless of the amount of sunlight. I'm trying to get the work flow down for the Nodal Ninja so that we can use it next week on a scan project we have planned on the campus of East Carolina University. More to come soon... |
|
