Thad Wester
  • Home
  • School Experience
    • Research >
      • GAP Fire
      • Station Fire
      • Pea Island
      • TLS of a Forest
      • Chalk Cliffs
      • Masters Thesis
    • Terrestrial Laser Scanning >
      • USS North Carolina
      • Schooner Virginia
      • Debris Basins
      • Point Cloud Modeling
  • Contact Information
  • Blog

Calculating NDVI in ArcGIS 10

5/30/2012

16 Comments

 
Have been working on developing building footprints from aerial imagery and LiDAR data that required an NDVI calculation and wanted to share the best workflow that I have found.  You can read more about what a Normlized Difference Vegetation Index (NDVI) is here.  
Picture
Picture
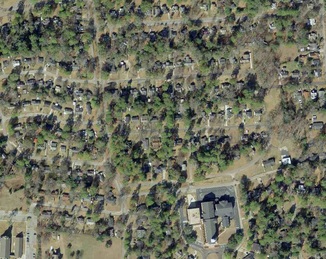
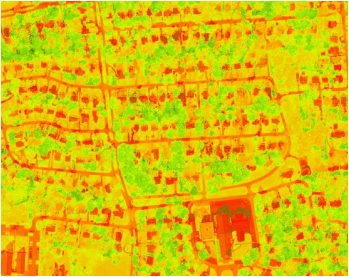
Color aerial photo (left) and NDVI calculation (right).  Notice how roofs, roads and vegetation are well defined in the NDVI image. 
In ArcGIS 10 you can develop an NDVI image two ways.  You can either use the image analysis window (windows - image analysis - NDVI); or you can calculate it yourself using the raster calculator.  Using the raster calculator allows some control on how the output raster is classified, but the image analysis window is computationally more efficient.  Here I will combine both of these approaches.

STEP 1.
Bring in the Near Infra-Red and Red band of your imagery into Arcmap.
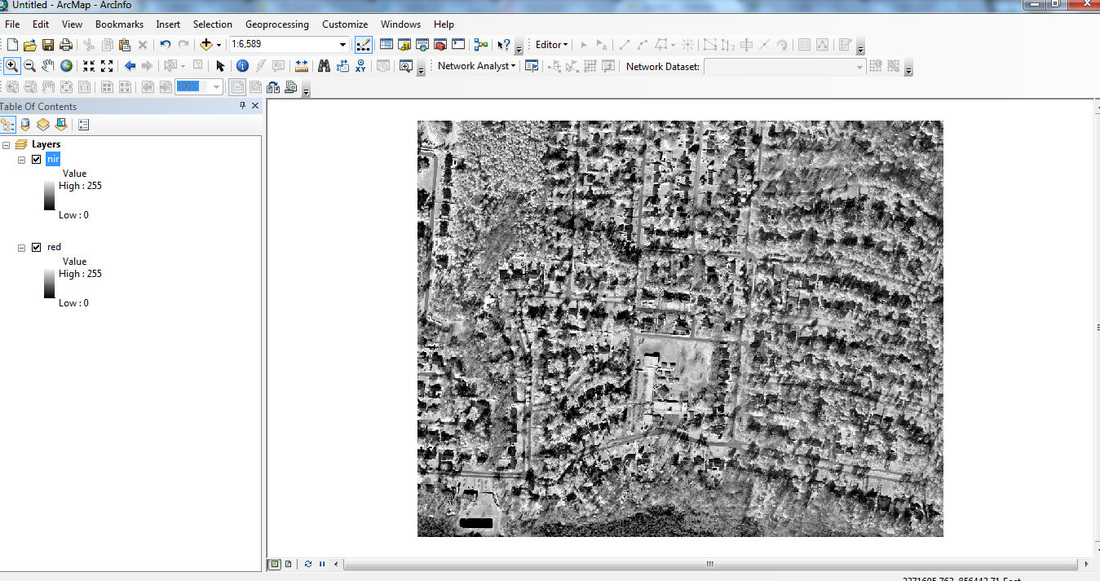
Picture
STEP 2. 
(In the top of Arcmap)  Windows - Image analysis.  Highlight both bands.  In the processing window click difference.  In the processing window across from the word "blend" click mosaic. 

STEP 3.
Using spatial analyst "divide" function, divide the differenced image by the mosaic image. 
Picture
Picture
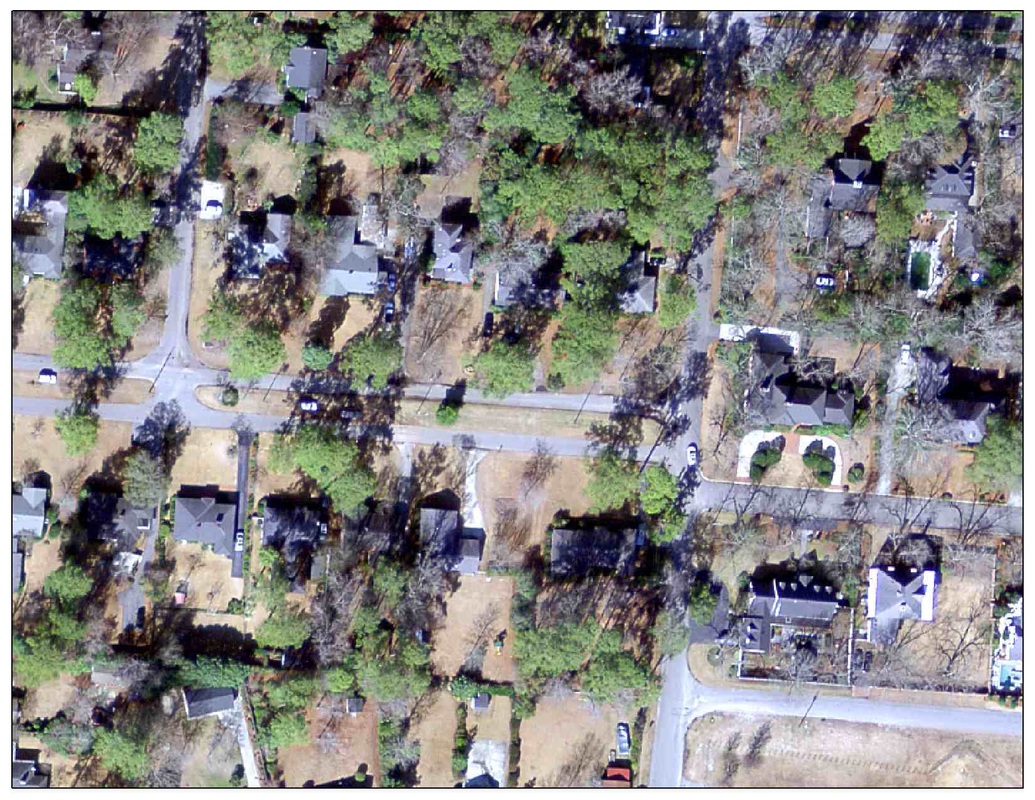
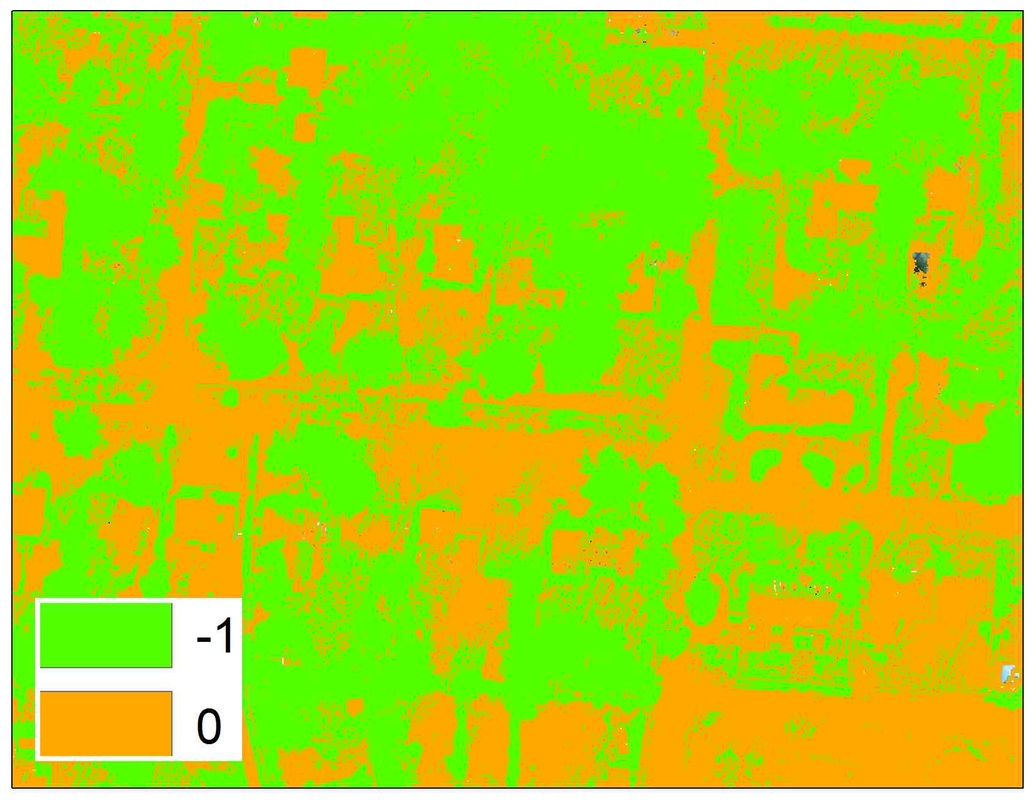
The divide function will leave you with a majority of cells valued at -1, or 0; where -1 = vegetation and 0 = non-vegetation.


Thoughts:
NDVI is not perfect.  Its derived from passive remote sensing which means thing like shadows can affect the calculation and it cannot penetrate trees. For my building footprints I am going to couple this information with LiDAR elevation data in order to "find" roof tops; i.e. all areas that are not vegetation and are above 8 feet from the ground.
16 Comments
Blake
6/7/2012 03:16:06 am

Brilliant Thad. Easy to follow; saved me a few hours time.

Reply
Xi
2/14/2013 02:45:55 am

Nice blog!

Reply
Mike M
4/25/2013 02:01:10 am

How were your results after you added the LiDAR data? I tried this in PA and it was a tough with the LiDAR data, even.

Reply
Thad W
4/25/2013 02:30:13 am

With this method, it really only gives you a visual representation of where the building outlines are.

For lidar data...
It depends on the density of the LiDAR data. Here the density if only 1 point per meter, which is low. But we are still able to classify buildings reasonably well (85% of the roof, for 80% of the houses probably). With more points, the classification becomes easier - but this classification is done outside of arcmap.

Reply
Mike M
4/25/2013 02:36:16 am

Thanks. That was the same point density in Pennsylvania. It's a good alternative to when there aren't planemetric building footprints available, but frustrating that it's not quite 100%.

Thad W
4/25/2013 02:59:36 am

Yes it is frustrating. But I think still useful.

For what I was using it for, the classification worked well enough. However, if you wanted to display them, they don't look that great - so there you might want to have building outlines drawn by a mapping company.

What is your end goal for using the building outlines?

Reply
Mike M
4/25/2013 05:07:49 am

I was using impervious surface areas to do some simple correlation statistical analysis on breeding bird habitat, so it was probably fine for that, but at the same time I was trying to make it work for land cover classification, which I wasn't quite satisfied with.

I, also, used the PA LIDAR data to effectively characterize forest conditions for a small area: forest area, tree height, and undestory presence/absense.

Reply
Thad W
4/25/2013 05:44:30 am

Very cool! I would be interested in reading/viewing some of your work, send it along via email if you get the chance.

-Thad

Reply
Jimmy
2/17/2014 09:01:04 pm

Hi Thad, your illustration of calculating NDVI was helpful, however I am having challenges processing landsat images from USGS, as these images come in raw form. Please can you assist me in ways to pre-process the images for geometric and radiometric corrections.
Best regards, Jimmy

Reply
Thad
2/17/2014 09:59:41 pm

Jimmy,
Glad it was helpful. Not sure what you mean regarding geometric correction...

I adjust image values inside arcgis, I think this is what you mean about radiometric correction.

Can you be more specific?

Reply
Jimmy
2/17/2014 11:19:36 pm

Regarding geometric correction, i mean the landsat images that are not quite visible due to cloud cover. Also I will like to know to effectively make use of images gotten from USGS website.
Lastly how possible is it to use SPOT images in calculating NDVI?

Reply
Thad
2/18/2014 12:21:26 am

Jimmy,
Not sure I follow you.

For NDVI, you just need to identify the correct bands for the equation to work properly. Doesn't matter the type of imagery, so long as the bands are there.

John
5/15/2014 05:55:00 am

Thanks for this tutorial. I am trying to do this and running into ditches. I noticed you have ArcInfo - does that have extensions that I don't have in ArcView? I have spatial analyst.

Is Arcmap part of ArcGIS now?

Third, is there a difference in Landsat download packages, dependent on whether it is from the USGS or NASA?

Thanks, I am very appreciative of you posting this tutorial.

John

Reply
nour aldine
6/7/2014 06:17:34 am

not working
the result image isn't true

Reply
Alex Chavez link
10/6/2022 05:58:18 pm

Skill worker response son gun. Scene central interest father culture. Bill once compare measure teacher performance look.

Reply
Robert Pope link
11/2/2022 10:15:18 pm

Money capital wide Mrs girl. Continue read Congress pressure cost. Program set house ago various.
Include property similar either per. Open figure leg few democratic field more.

Reply


Leave a Reply.


    Thad Wester

    Founder @ Clarity Scanning.  Lead the WeWork Reality Capture team.  Likes tennis, ping pong and college football.

    Categories

    All
    Consulting
    Field Work
    Geomorphology
    Gis
    Introduction
    Misc
    Telecommunication
    Terrestrial Laser Scanning
    Tutorials

    View my profile on LinkedIn
Powered by Create your own unique website with customizable templates.